Histograms:
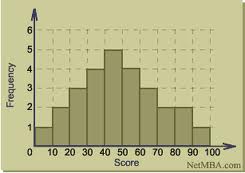
-A lot like bar graphs but the main difference is that they MUST have order.*Give the graph a title and label the x & y axis
-Pictures of Histograms:

Bar Graphs:
*Order does not matter!!!
Math is Fun!! -Bar graph website

Circle Graphs:
-These represent categorical data and also part of a whole.
- The first step is to lay out all of the information on a dot plot
- Find the decimal of each number out of the whole.
- convert the decimals into percents.
- Multiply the decimals by 360 to find out how big to make the portion of the graph.
- Make sure to have protactor and a ruler!!

I know that the difference between histograms and bar graphs is something that was important to understand, especially for students. I think you did a great job showing the difference between the two.
ReplyDelete